Charting Data from Multiple Worksheets or Workbooks
This can be a sticky wicket if you’ve ever inherited a workbook that has charts linking data from several locations. Until you know how its put together, you either don’t change anything, or change one thing and watch all of it fall apart. To address this rather unpleasant choice, let’s first understand how it gets built. Once that’s clear, making changes will feel more like “I can do this!” and less like “I hope this works!”
Let’s say we have four otherwise identical worksheets, except that each one has data for a particular quarter.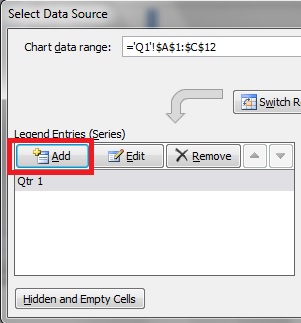
- From the first data set you want to chart, press F11 (PC only). This will create a chart on a separate worksheet.
- Now, right click on the chart and choose Select Data….
- On the next dialog box, you will see the currently charted range at the top and the currently laid out data on the bottom. Click the Add button from the left side of the dialog box under Legend Entries.
- With your cursor blinking in the Series name: field, click the collapse button
 and navigate to the worksheet holding the next data series.
 - Click the cell with the column title for the next series.
- Click the Expand button.
- Click in the Series values: field
- Click the Collapse button
- Select the cells with the data under the column title you just identified.
- Click the Expand button.
Repeat these steps for the remaining ranges. Then, click OK. You’ll notice that the Chart data range: field is now blank. Once the chart becomes more complex than a data series on a single worksheet, Excel can no longer identify the range in this field. On the right hand side of that Select Data Source dialog box are the X axis values. These should be set once with the original chart step, so that they match up with data items.
So, now that you know how to make one, reverse engineering should be easy to figure out. Simply right click the chart and choose Select Data, and examine each series on the left with the Edit button. You can use the Remove button to get rid of a series and the up and down arrows to change the order in which the series are plotted.