PowerPoint: Integrating charts and tables from Excel
Pasting Excel data into PowerPoint is pretty straightforward in newer Microsoft Office versions. To position data correctly, click into the content placeholder that says “Click to add text.” PowerPoint will automatically size and position your content to fit in the placeholder. You can tweak the size and format after pasting to fine-tune the appearance. Paste with a right-click or Ctrl+V. Then use the Paste Options box to fine-tune how you would like the content incorporated into the slide.
Paste options for data
Copy the cell range you wish to use from Excel. With your cursor clicked in the content placeholder in PowerPoint, press Ctrl+V. Choose one of the following from the Paste Options box.
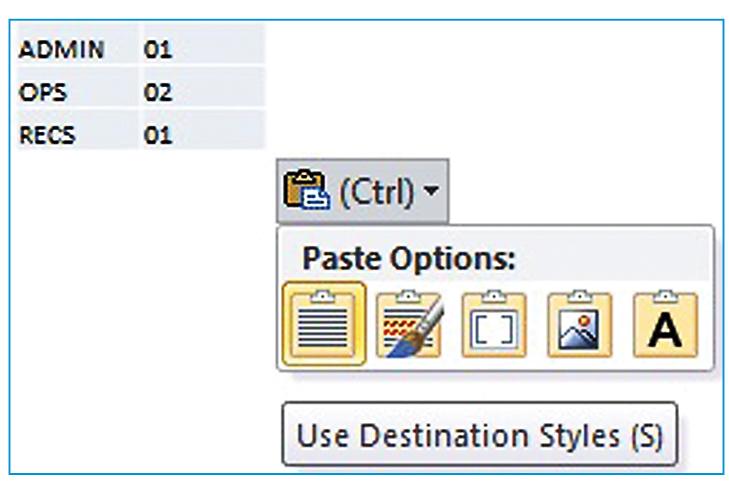
- Use Destination Styles. Pastes your Excel data as a Table in PowerPoint using the default table style.
- Keep Source Formatting. Pastes your Excel data as a Table but uses the formatting you chose in Excel.
- Embed. Pastes data with Source Formatting and inserts the entire workbook into your presentation file. You only see the data you copied, but you can edit the embedded workbook by right-clicking on it, choosing Worksheet Object and Edit to make changes.
- Picture. This is the safest option to ensure that no changes are made to the data once you paste it. It uses Source Formatting.
- Text. Pastes the text only. It’s best to create the Table in which you’d like the data to appear.
Depending upon which option you choose, it may be necessary to increase the size of the font. You can do this easily by selecting your text and using the Increase Font Size button or the Ctrl+> (Ctrl+Shift+.) shortcut.
Paste options for charts
You can also paste charts into presentations. These paste options are available for charts.
- Use Destination Theme & Embed Workbook. Works like the Embed option for data and uses the theme chosen in PowerPoint.
- Keep Source Formatting & Embed Workbook. Works like the Embed option for data and uses the theme chosen in Excel.
- Use Destination Theme & Link Data. Embeds the entire workbook in your presentation file. The chart remains linked to the Excel file in which it was created and uses the theme chosen in PowerPoint.
- Keep Source Formatting & Link Data. Embeds the entire workbook in your presentation file. The chart remains linked to the Excel file in which it was created and uses the theme chosen in Excel.
- Picture. Same as with Excel ranges, this option is the safest when you want to ensure that no changes are made to the data once you paste it. It will use Source Formatting.